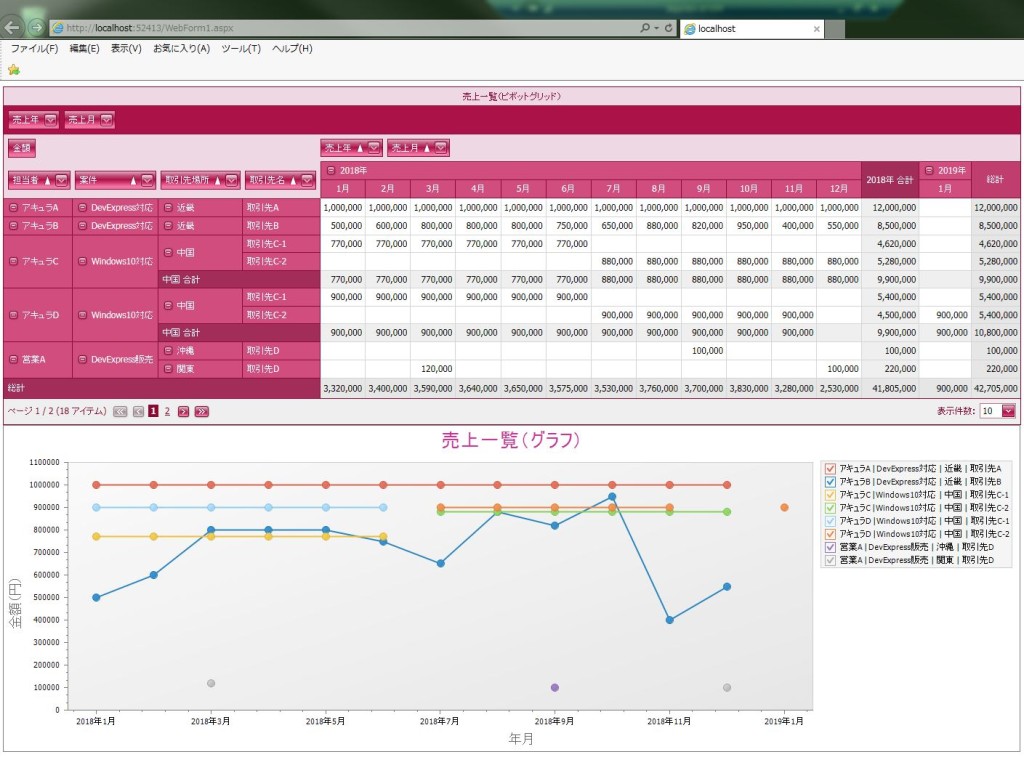
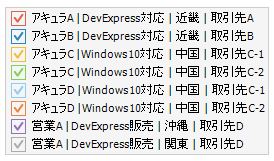
DevExpress でのピボットグリッド(ASPxPivotGrid)のグラフ(WebChartControl)凡例の個別非表示設定のサンプルです。
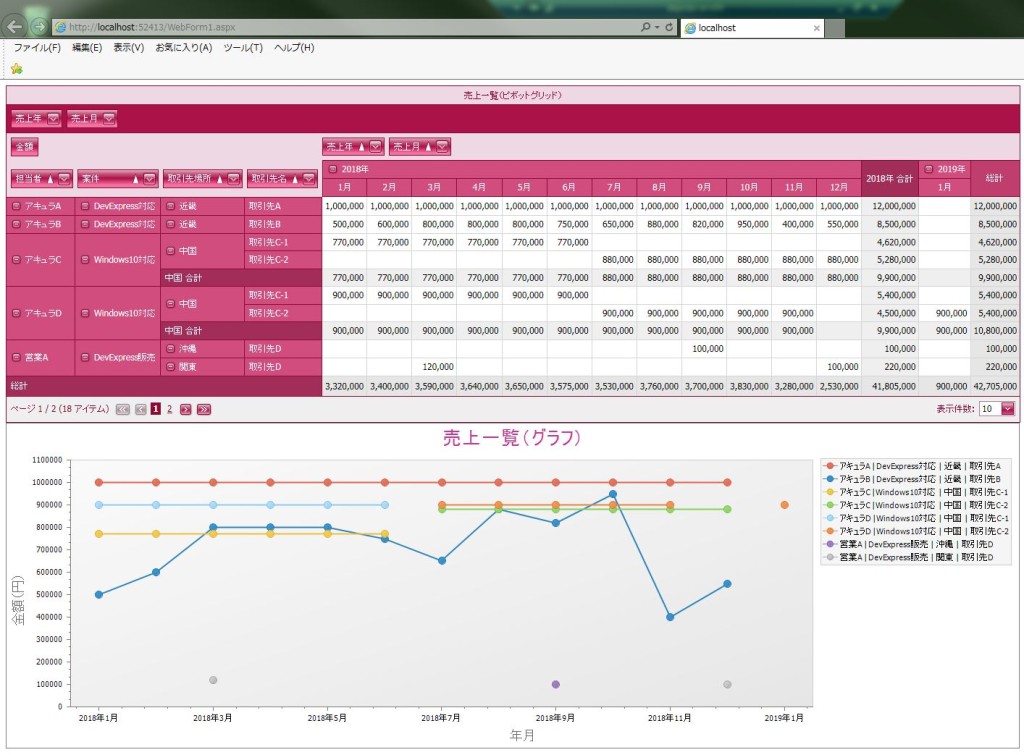
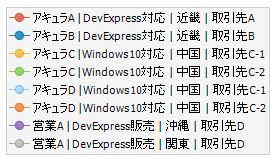
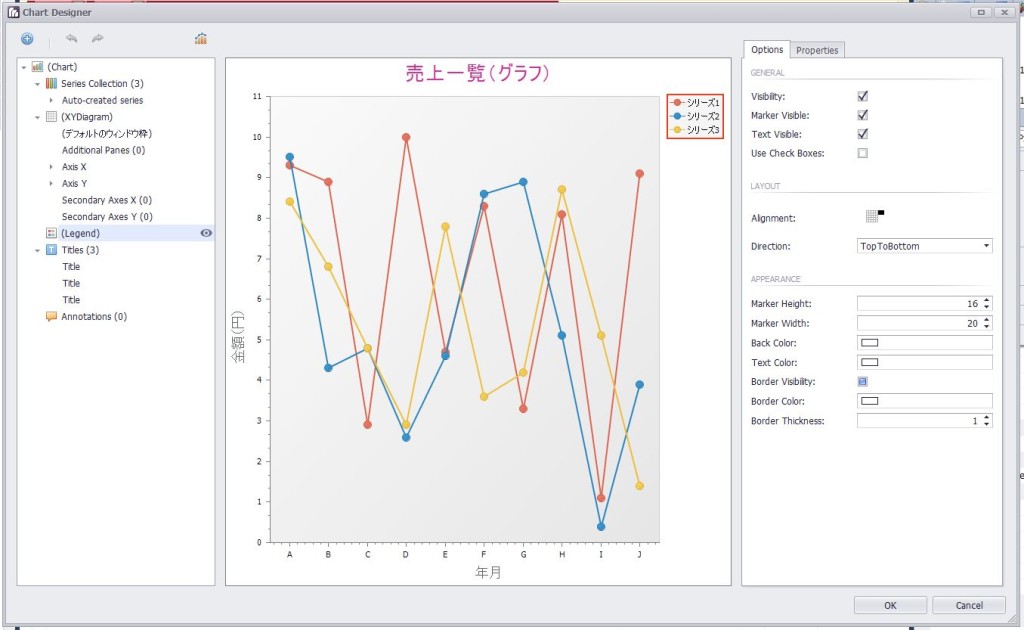
現状の画面デザインはこのようになっています。
<ピボットグリッドのグラフ凡例の個別非表示設定>
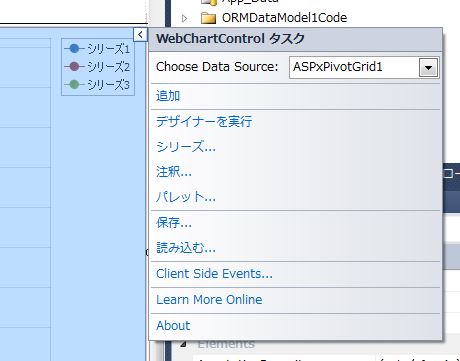
・「WebChartControl」の「>」からメニューを表示して、「デザイナーを実行」を選択します。
↓
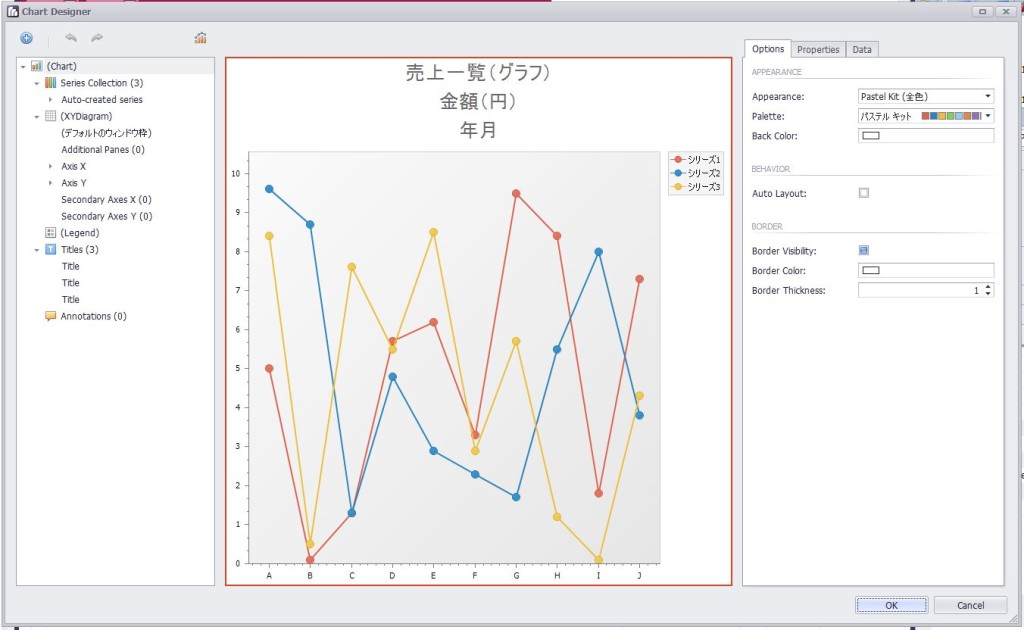
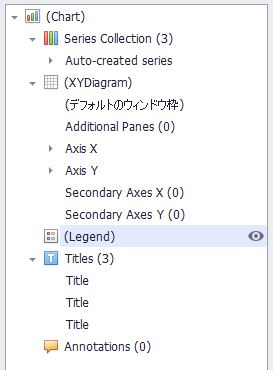
・「Legend」を選択します。
↓
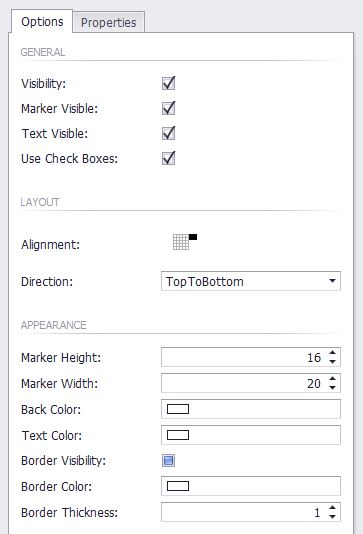
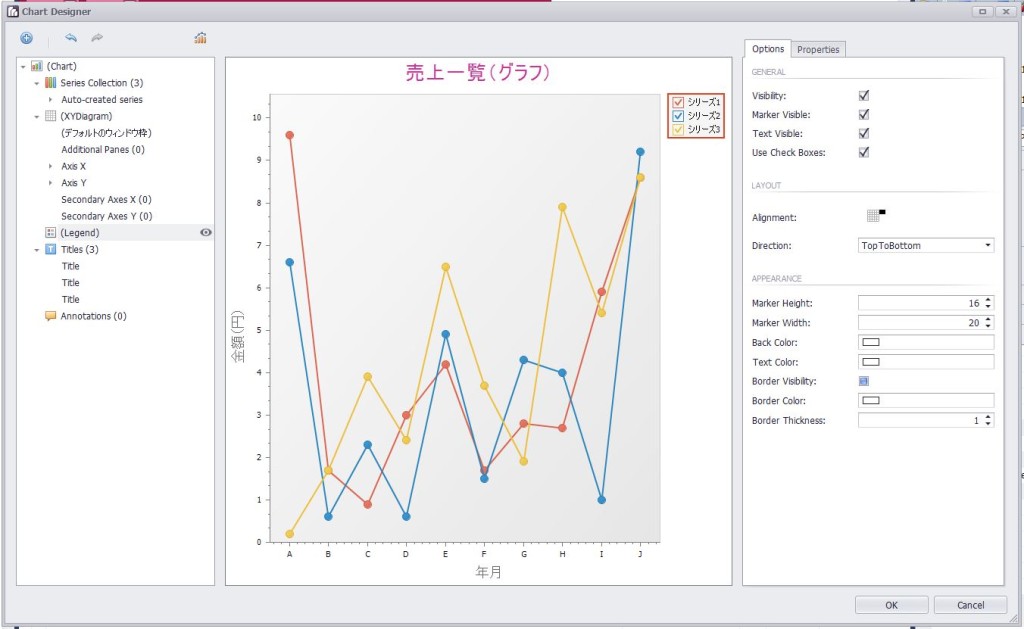
・「GENERAL」の「Use Check Boxes」に対して「ON」を選択します。
※「WebChartControl」の「Legend」に対して「UseCheckBoxes=”True”」を設定
↓
【サンプルプログラム】
|
1 2 3 4 5 6 7 8 9 10 11 12 13 14 15 16 17 18 19 20 21 22 23 24 25 26 27 28 29 30 31 32 33 34 35 36 37 38 39 40 41 42 43 44 45 46 47 48 49 50 51 52 53 54 55 56 57 58 59 60 61 62 63 64 65 66 67 68 69 70 71 72 73 74 75 76 77 78 79 80 81 82 83 84 85 86 87 88 89 90 91 92 93 |
<form id="form1" runat="server"> <div> <dx:ASPxPivotGrid ID="ASPxPivotGrid1" runat="server" ClientIDMode="AutoID" DataSourceID="XpoDataSource1" EnableTheming="True" Theme="RedWine" Caption="売上一覧(ピボットグリッド)"> <Fields> <dx:PivotGridField ID="fieldKINGAKU" Area="DataArea" AreaIndex="0" FieldName="KINGAKU" Caption="金額" CellFormat-FormatString="#,###" CellFormat-FormatType="Numeric"> </dx:PivotGridField> <dx:PivotGridField ID="fieldAQUREXNAME" Area="RowArea" AreaIndex="0" FieldName="AQUREX_NAME" Caption="担当者"> </dx:PivotGridField> <dx:PivotGridField ID="fieldPROJECT" Area="RowArea" AreaIndex="1" FieldName="PROJECT" Caption="案件" TotalValueFormat-FormatString="{0} 合計" TotalValueFormat-FormatType="Custom"> </dx:PivotGridField> <dx:PivotGridField ID="fieldTORIHIKICHIHOCHIHOMEI" Area="RowArea" AreaIndex="2" FieldName="TORIHIKI_CHIHO.CHIHOMEI" Caption="取引先場所" TotalValueFormat-FormatString="{0} 合計" TotalValueFormat-FormatType="Custom"> </dx:PivotGridField> <dx:PivotGridField ID="fieldTORIHIKICOMPANY" Area="RowArea" AreaIndex="3" FieldName="TORIHIKI_COMPANY" Caption="取引先名"> </dx:PivotGridField> <dx:PivotGridField ID="fieldTORIHIKITANTO" Area="RowArea" AreaIndex="4" FieldName="TORIHIKI_TANTO" Visible="False" Caption="取引先担当者"> </dx:PivotGridField> <dx:PivotGridField ID="fieldSALESEDATE" Area="ColumnArea" AreaIndex="0" FieldName="SALESE_DATE" Caption="売上年" GroupInterval="DateYear" UnboundFieldName="fieldSALESEDATE" TotalValueFormat-FormatString="{0}年 合計" TotalValueFormat-FormatType="Custom" ValueFormat-FormatString="{0}年" ValueFormat-FormatType="Custom"> </dx:PivotGridField> <dx:PivotGridField ID="fieldSALESEDATE1" Area="ColumnArea" AreaIndex="1" FieldName="SALESE_DATE" Caption="売上月" GroupInterval="DateMonth" UnboundFieldName="fieldSALESEDATE1"> </dx:PivotGridField> <dx:PivotGridField ID="fieldSALESEDATE2" AreaIndex="0" FieldName="SALESE_DATE" Caption="売上年" GroupInterval="DateYear" UnboundFieldName="fieldSALESEDATE2"> </dx:PivotGridField> <dx:PivotGridField ID="fieldSALESEDATE3" AreaIndex="1" FieldName="SALESE_DATE" Caption="売上月" GroupInterval="DateMonth" UnboundFieldName="fieldSALESEDATE3"> </dx:PivotGridField> </Fields> <OptionsChartDataSource ProvideDataByColumns="False" /> <OptionsPager Position="Bottom"> <FirstPageButton Visible="True"> </FirstPageButton> <LastPageButton Visible="True"> </LastPageButton> <PageSizeItemSettings Caption="表示件数:" Visible="True"> </PageSizeItemSettings> </OptionsPager> </dx:ASPxPivotGrid> </div> <div> <dxchartsui:WebChartControl ID="WebChartControl1" runat="server" AppearanceNameSerializable="Pastel Kit" CrosshairEnabled="True" DataSourceID="ASPxPivotGrid1" Height="450px" SeriesDataMember="Series" Width="1400px"> <DiagramSerializable> <cc1:XYDiagram> <axisx title-text="売上年 売上月" title-visibility="Default" visibleinpanesserializable="-1"> <datetimescaleoptions aggregatefunction="None" scalemode="Automatic"></datetimescaleoptions></axisx> <axisy title-text="金額" title-visibility="Default" visibleinpanesserializable="-1"> <gridlines visible="False"></gridlines></axisy> </cc1:XYDiagram> </DiagramSerializable> <Legend MaxHorizontalPercentage="30" UseCheckBoxes="True" Visibility="True"></Legend> <SeriesTemplate ArgumentDataMember="Arguments" ArgumentScaleType="Qualitative" ValueDataMembersSerializable="Values"> <viewserializable> <cc1:LineSeriesView> </cc1:LineSeriesView> </viewserializable> </SeriesTemplate> <Titles> <cc1:ChartTitle Text="売上一覧(グラフ)" TextColor="204, 51, 153" /> <cc1:ChartTitle Dock="Left" Text="金額(円)" Font="Tahoma, 12pt" Visibility="True" /> <cc1:ChartTitle Dock="Bottom" Text="年月" Font="Tahoma, 12pt" Visibility="True" /> </Titles> </dxchartsui:WebChartControl> </div> <div> <dx:XpoDataSource ID="XpoDataSource1" runat="server" TypeName="Sample_07.SAMPLE.SALESE_INFO"> </dx:XpoDataSource> </div> </form> |
それでは、実行して動作確認を行います。
↓
無事にピボットグリッド(ASPxPivotGrid)のグラフ(WebChartControl)凡例の個別非表示設定が出来ました。
個別非表示の使い方は、1つのデータを非表示に出来ます。
凡例の「アキュラA」のチェックボックスを「OFF」にすると、「アキュラA」のデータが非表示なりました。
次に、「アキュラB」のチェックボックスを「OFF」にすると、「アキュラA」のデータが表示され、「アキュラB」のデータが非表示なりました。

