DevExpress の ASPxSpreadsheet でのグラフ作成位置設定(サーバー側)のサンプルです。
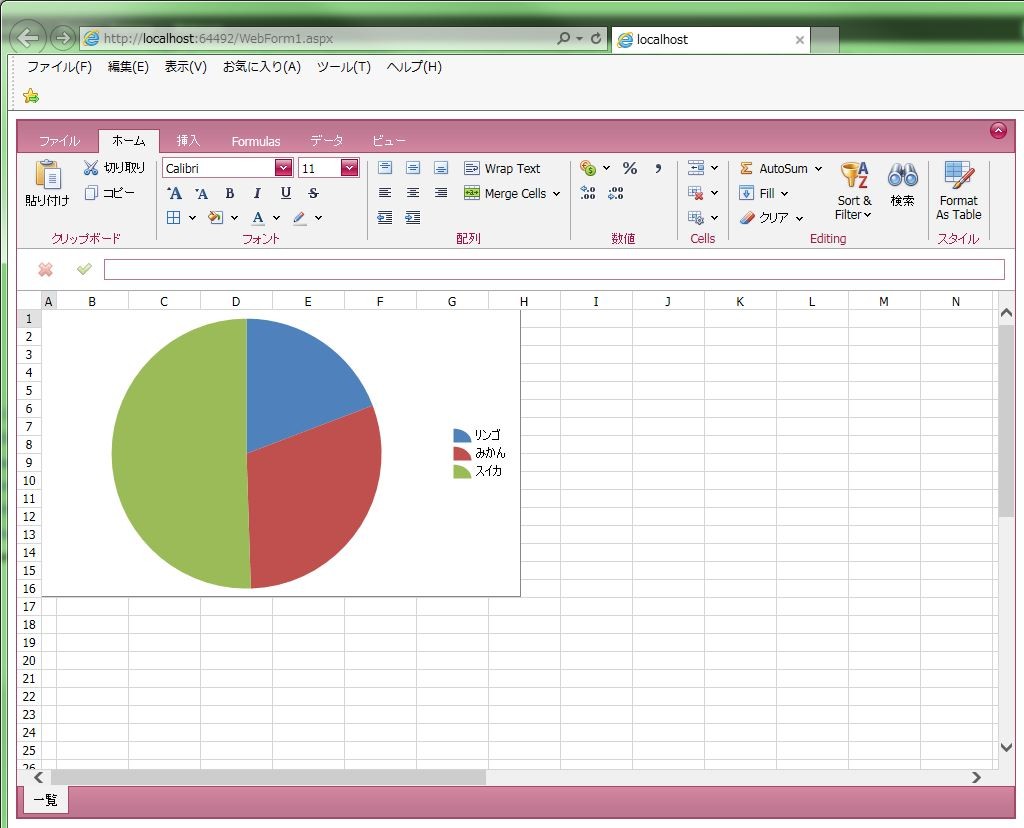
現状の画面デザインはこのようになっています。
※一覧表とグラフが重なっています。
<グラフ作成位置設定(サーバー側)>
「myChart.TopLeftCell = .Cells(“B7″)」、「myChart.BottomRightCell = .Cells(“G22″)」を設定します。
【サンプルプログラム(VB.Net)】
|
1 2 3 4 5 6 7 8 9 10 11 12 13 14 15 16 17 |
Protected Sub Page_Load(ByVal sender As Object, ByVal e As System.EventArgs) Handles Me.Load Dim myFilePath As String = String.Empty 'エクセルファイルパス取得 myFilePath = System.IO.Path.Combine(ASPxSpreadsheet1.WorkDirectory, "data_04.xlsx") 'エクセルファイルオープン ASPxSpreadsheet1.Open(myFilePath) With ASPxSpreadsheet1.Document.Worksheets("一覧") Dim myChart As DevExpress.Spreadsheet.Charts.Chart myChart = .Charts.Add(DevExpress.Spreadsheet.Charts.ChartType.Pie, .Range("F3:G5")) 'グラフ位置設定 myChart.TopLeftCell = .Cells("B7") myChart.BottomRightCell = .Cells("G22") End With End Sub |
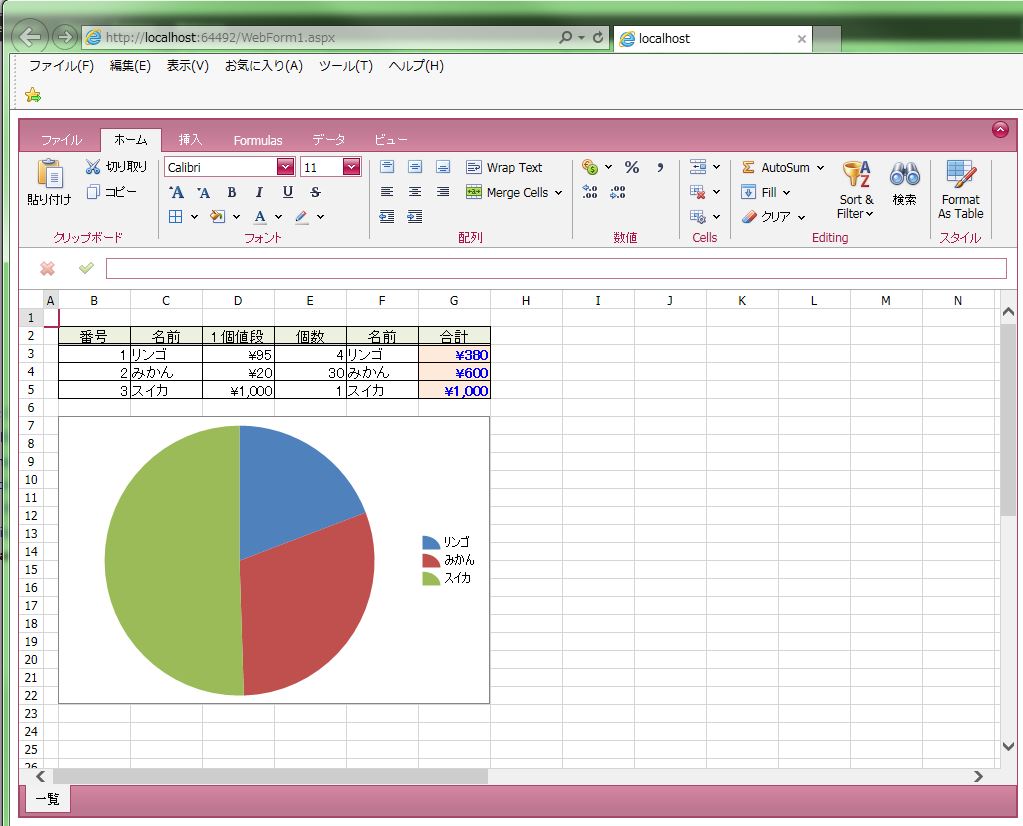
それでは、実行して動作確認を行います。
↓
無事にエクセル表示のグラフ作成位置設定(サーバー側)が出来ました。
- 投稿タグ
- ASPxSpreadsheet


